Create Your First Project
Start adding your projects to your portfolio. Click on "Manage Projects" to get started
Visualizing COVID-19 Pandemic Health Data
Project Type
Data Visualization
Project Overview:
This data visualization project analyzed the impact of the COVID-19 pandemic on mortality rates across various health conditions in Texas. Using Tableau, the study visualized trends in mortality before and during the pandemic, covering a wide range of diseases, including Alzheimer’s, dementia, cancer, respiratory illnesses, and circulatory diseases. The objective was to identify patterns, correlations, and potential policy implications for healthcare systems.
Key Objectives:
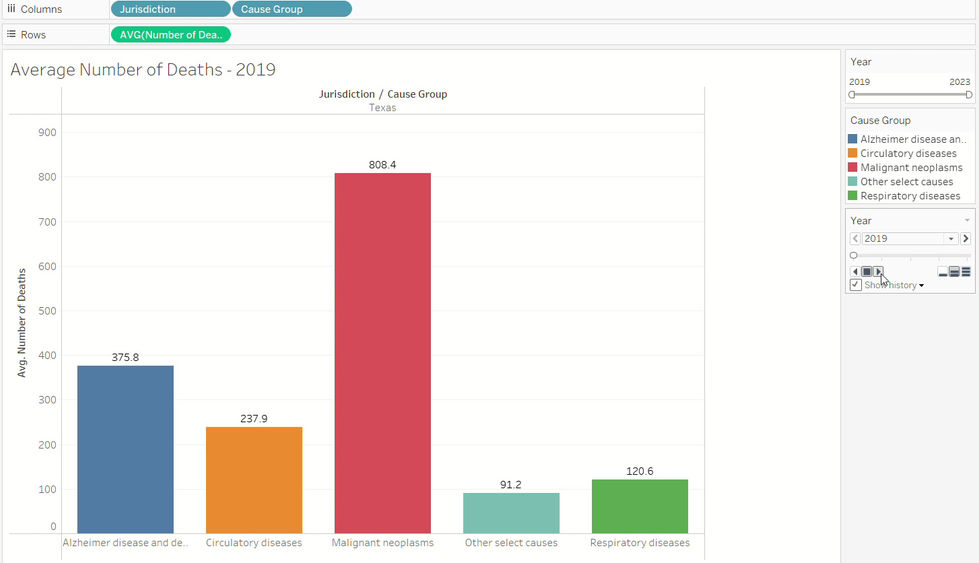
1. Assess COVID-19’s Impact on Mortality Trends – Examine the changes in death rates from 2019 to 2020 across different disease categories.
2. Identify At-Risk Populations – Evaluate the pandemic’s effect on vulnerable groups, particularly those with chronic illnesses.
3. Analyze Healthcare Disruptions – Understand how the pandemic influenced access to treatment and healthcare services.
4. Provide Insights for Policy and Preparedness – Use data-driven visualizations to recommend improvements in healthcare infrastructure for future crises.
Data Sources & Attributes:
The project utilized three publicly available datasets:
1. Weekly Counts of Deaths in Texas (2019-2022)
o Source: CDC – National Center for Health Statistics
o Attributes: Jurisdiction, Date, Year, Cause Group, Cause Subgroup, Number of Deaths, Average Deaths in Time Period.
2. Conditions Contributing to COVID-19 Deaths
o Source: Data.gov
o Attributes: Start/End Date, Year, Month, State, Condition Group, Condition, Age Group, COVID-19 Deaths, Number of Mentions.
3. Nutrition, Physical Activity, and Obesity – Behavioral Risk Factor Surveillance System
o Source: Data.gov
o Attributes: Start/End Year, Location, Class, Topic, Question, Gender, Data Value, Confidence Intervals, Sample Size.
Data Cleaning & Processing:
• MS Excel was used for data cleansing, handling missing values, and structuring datasets for analysis.
• Tableau served as the primary visualization tool, transforming the cleaned data into interactive dashboards.
Hypothesis Testing & Key Findings:
The study explored five hypotheses, validated through Tableau visualizations:
1. Alzheimer’s & Dementia Mortality Increased by 27%
• Findings: The pandemic led to social isolation and disruptions in routine care, contributing to a sharp rise in Alzheimer’s and dementia-related deaths.
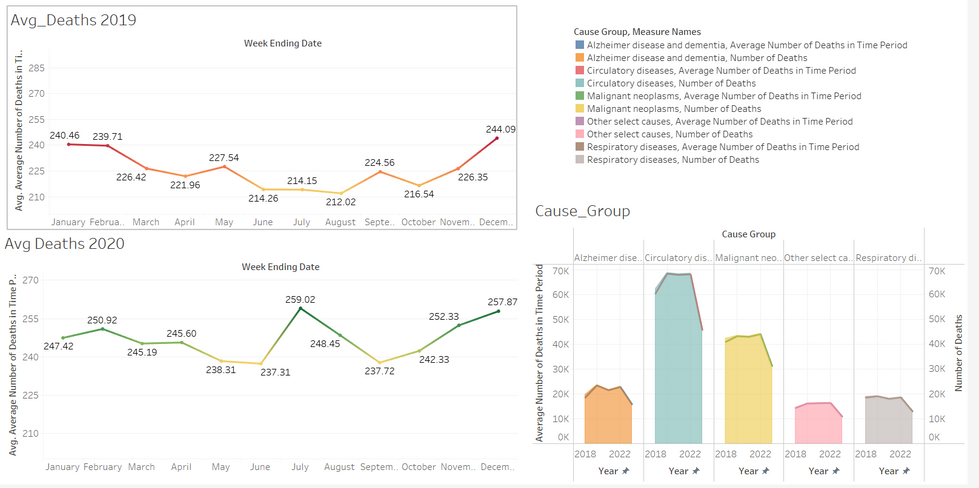
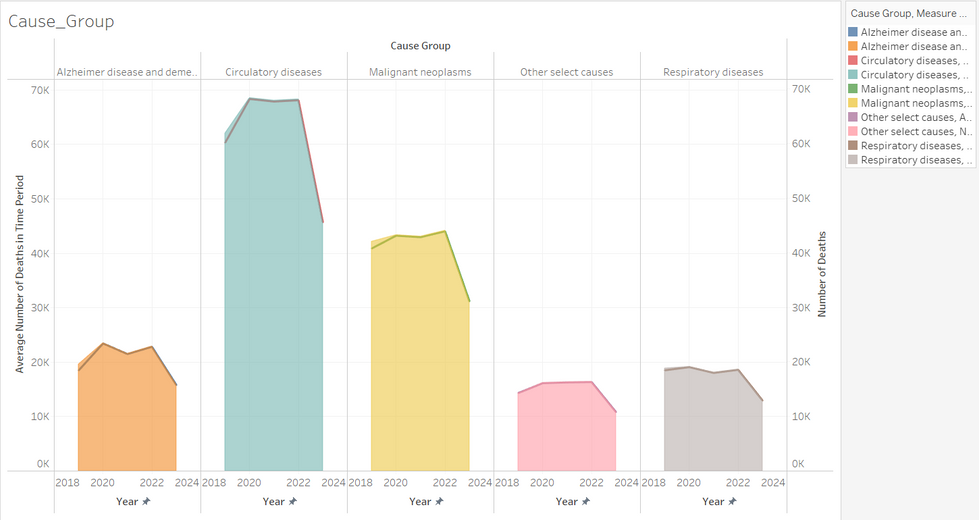
• Tableau Insights: Bubble charts and trend lines highlighted a notable mortality surge in 2020 compared to 2019.
2. Cancer-Related Deaths Increased by 5.7%
• Findings: The pandemic caused delays in cancer diagnosis and treatment, increasing mortality slightly.
• Tableau Insights: Peaks in death rates corresponded with COVID-19 surges, revealing healthcare system strain.
3. Respiratory Disease Mortality Increased by 3%
• Findings: The overlap between COVID-19 and existing respiratory conditions contributed to a mortality increase.
• Tableau Insights: Line graphs showed a clear rise in deaths during peak pandemic months.
4. Circulatory Disease Mortality Increased by 13% (Revised to 5%)
• Findings: Lifestyle changes during the pandemic (reduced physical activity, poor diet) likely played a role in cardiovascular mortality.
• Tableau Insights: Geographical heatmaps showed regional disparities in circulatory disease deaths.
5. Overall Mortality Increased by 11.6%
• Findings: COVID-19 indirectly contributed to an increase in non-COVID-related deaths, particularly among the elderly.
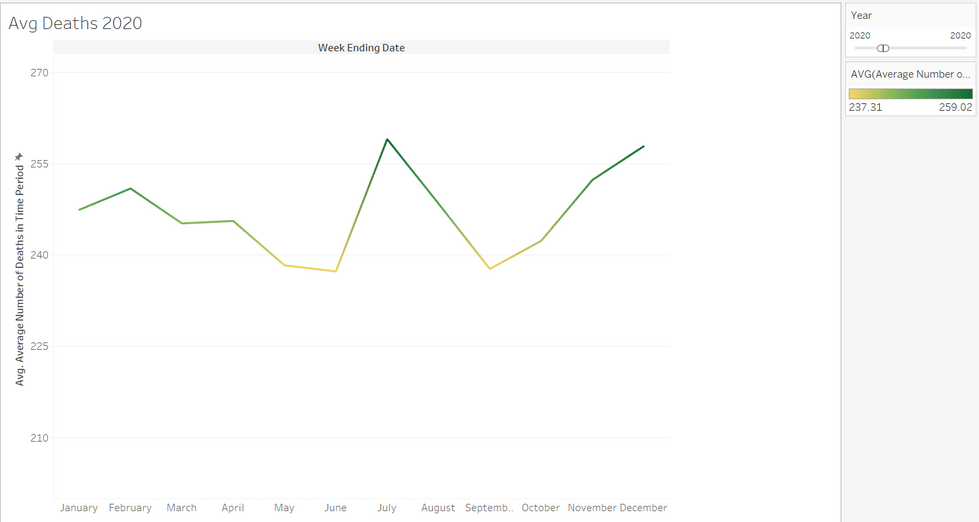
• Tableau Insights: Monthly mortality spikes aligned with major COVID-19 waves, confirming the hypothesis.
Conclusion & Impact:
This project provided a comprehensive analysis of COVID-19’s indirect health consequences, highlighting the pandemic's far-reaching effects beyond direct infections. The study emphasized the importance of resilient healthcare systems, improved chronic disease management, and better preparedness for future pandemics.


